
Sep 1, 2025
Last week of August wraps up with a classic deleveraging move.
Summary:
- A classic deleveraging week: front-end funding and short-tenor basis flipped negative into the mid-week flush, BTC broke the 113-119k base to tag ~107k, then stabilised into a tight band.
- Spot ETFs did not confirm capitulation as ETH ETFs finished +$1.08B net for the week while BTC ETFs were +$441M, with ETH holding above $4k throughout (intra-week low ~$4.25k).
- Breadth paused rather than reversed: BTC dominance attempted a retracement higher but failed to close up on the week, finishing roughly flat and still beneath the 60.5–61% neckline.
- The pivots appear straightforward: do daily ETF prints turn consistently positive in the first September sessions, does ETH/BTC hold ~0.04 as new support, and can BTC reclaim ~111.5-113k to avoid a drift toward 102-104k.
- Macro data will dominate the week, starting with a stronger-than-expected manufacturing report from China.
- Key US data, including the jobs report on Friday, will be closely watched for signs that could cement a September Fed rate cut.
- A few key economic data from the EU are also due, including unemployment, inflation and GDP data.
- Aside from macro-data, political pressures are in focus as a recent court ruling puts Trump's tariff policy in doubt.
ETH - flows shock to stabilisation; ETH/BTC ~0.040 decides whether rotation extends
- U.S. spot ETH ETFs posted a decisive +~$1.08B net across the week on Mon +$443.9M, Tue +$455.0M, Wed +$309.5M, Thu +$39.1M, with only Friday negative at –$164.6M.
- That front-loaded buying followed by a Friday wobble mapped cleanly to microstructure: funding and short-tenor basis compressed on the down-leg, then normalised as bids reappeared.
- On-chain remained orderly through the stress, no meaningful stETH/ETH dislocation and no surge in exchange inventories, so the pressure reads as leverage management, not collateral distress.
- Price action respected structure: ETH pulled back only to ~$4,250, never lost the $4k handle, and rebid from the low ~4k shelf. The relative chart is doing the heavy lifting.
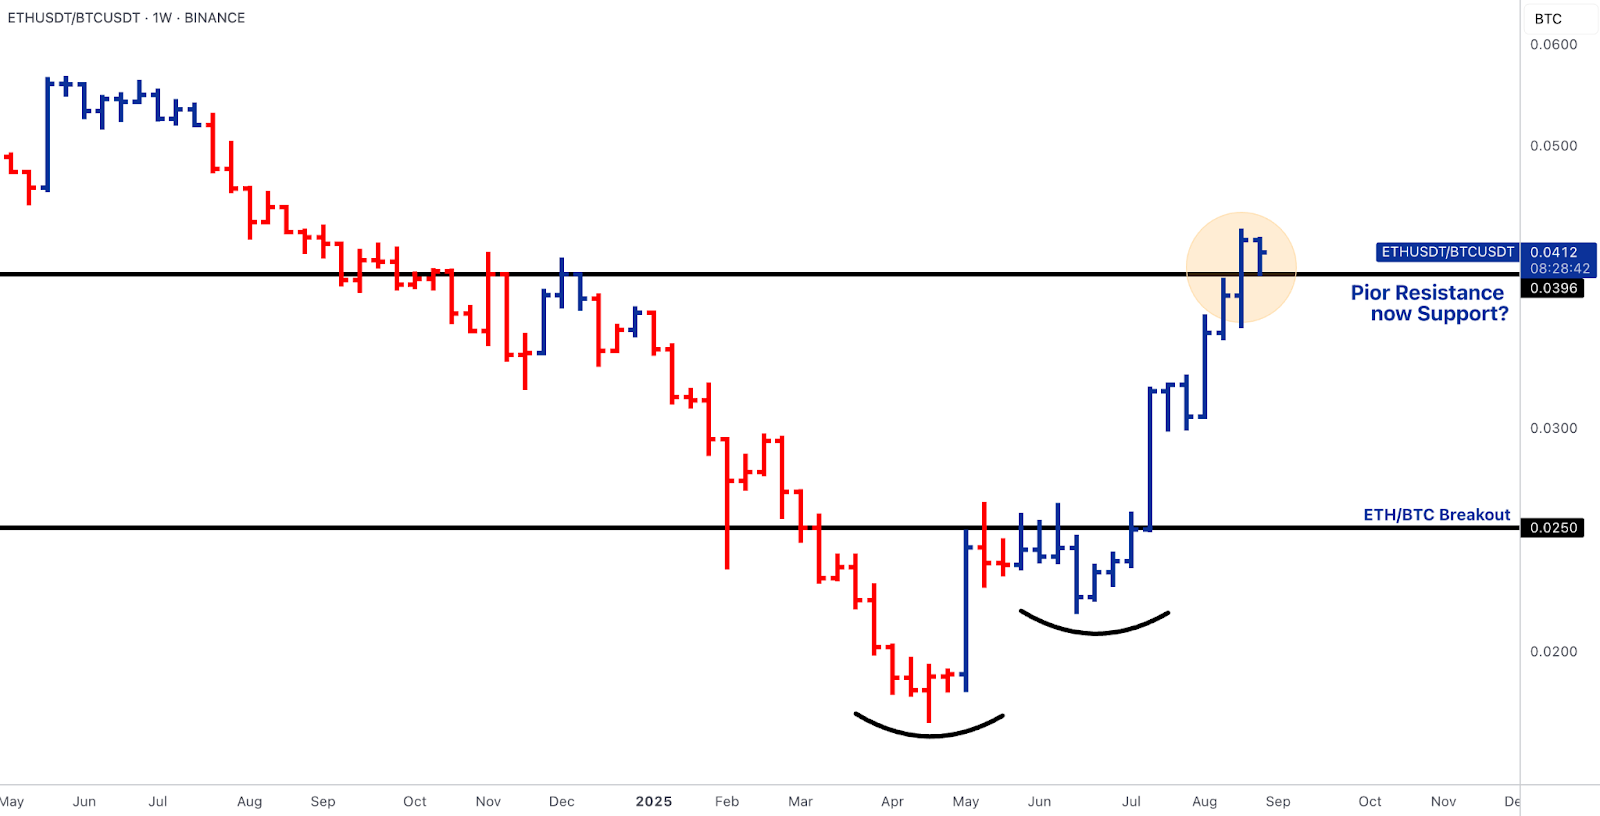
- After July’s clean breakout, ETH/BTC drove into, and is now retesting, the 0.0396–0.041 weekly band, a classic prior-resistance-to-support flip.
- If weekly acceptance holds above ~0.040, the path of least resistance remains higher toward ~0.043-0.046; a weekly close back below ~0.0396 would argue for a standard post-breakout retest in the ~0.034-0.035 zone rather than trend failure.
- With +~$1.08B of cash demand absorbing a volatile tape, last week looked like cash-flow validation, not a squeeze; the confirmation in early September is a return to consistently positive daily prints while that ~0.040 shelf holds.
BTC - base break to ~107k on deleveraging; ETFs net-buy; dominance flat below resistance
- Despite the breakdown in spot, BTC ETFs were net buyers: +~$441M on Mon +$219.1M, Tue +$88.1M, Wed +$81.4M, Thu +$178.9M, with Fri negative at –$126.7M.
- Four straight inflow days before a Friday give-back is the fingerprint of a derivatives-led de-risking, basis inverting, funding turning negative, and downside skew richening, rather than spot abandonment.
- Into the weekend, basis and funding bled back toward neutral and skew mean-reverted as realised vol cooled.
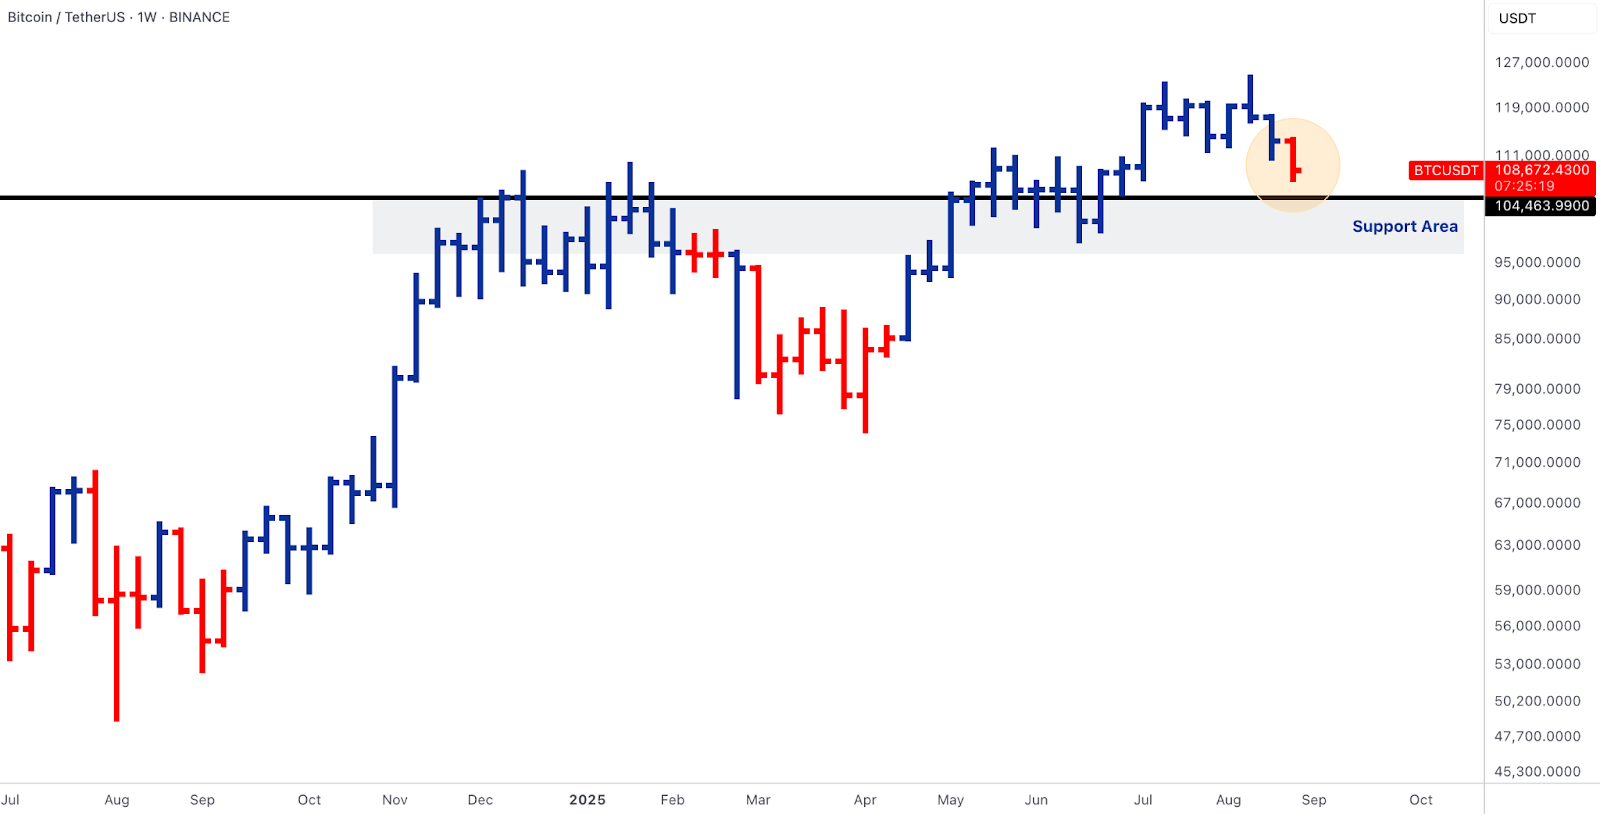
- Structurally, the market broke the $113-119k zone and wicked to ~107k, hovering around $108–109k.
- BTC is now sitting atop its support zone between $95-105k, carved out over the past few months.
- That sets crisp guardrails: a weekly reclaim of ~111.5–113k would put a bear-trap back on the table and reopen a path to range highs, whereas failure to reclaim keeps $102–104k as the first high-probability magnet.
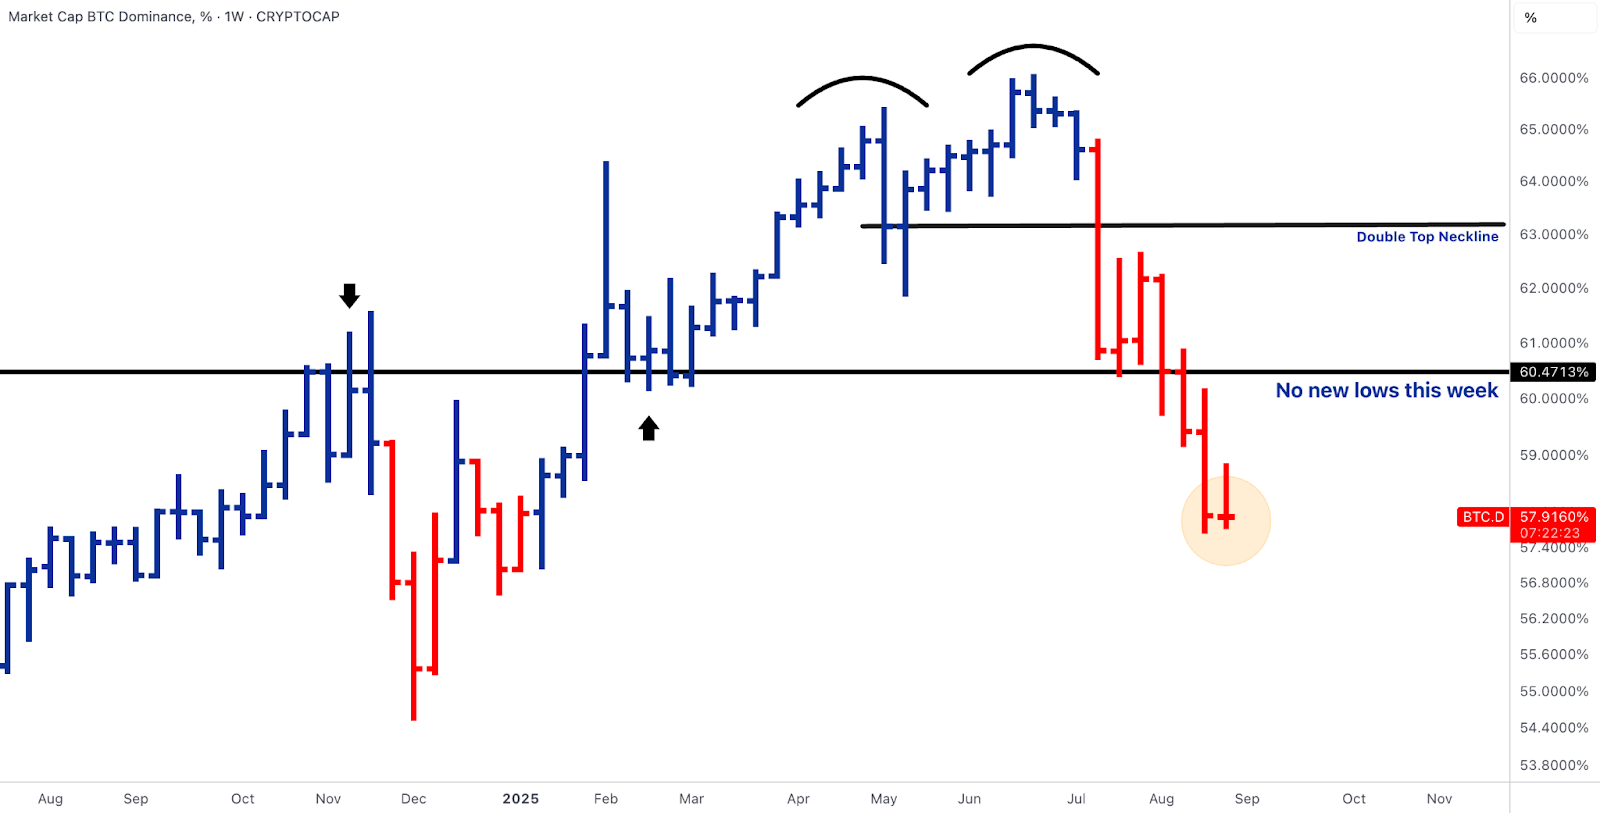
- On the relative side, BTC dominance did not make a new six-month low this week; it attempted a bounce but failed to close higher, finishing broadly flat and still below the 60.5–61% neckline.
- That configuration says breadth paused but has not rolled over, with alts retaining the benefit of the doubt unless dominance can reclaim that neckline.
SOL - incremental ETF filing progress meets a tight technical trigger
- Issuers filed/updated SOL spot-ETF paperwork again this week, which, while incremental, confirms active SEC-issuer iteration; filings only move when staff is engaging.
- The chart remains a study in compression: SOL is pinning the March-2024 high (~$200–205) from above a rising weekly trendline with $188–190 as the defence zone.
- Functionally, this is an ascending-triangle setup at resistance. A weekly acceptance above $206-210 unlocks a measured $45-55 extension, placing $250-260 in view for a first objective; failure back through $188-190 keeps the range intact and defers the signal.
- To judge durability, watch perps OI continuity through any breakout, funding that stays constructive rather than euphoric, and LST spreads (e.g., JitoSOL vs baseline staking) remaining tight; if those hold, a break is flow-sustained, not headline-rented.

Alpha cluster - POL, PYTH, IP (Story), CRO earned their bid this week
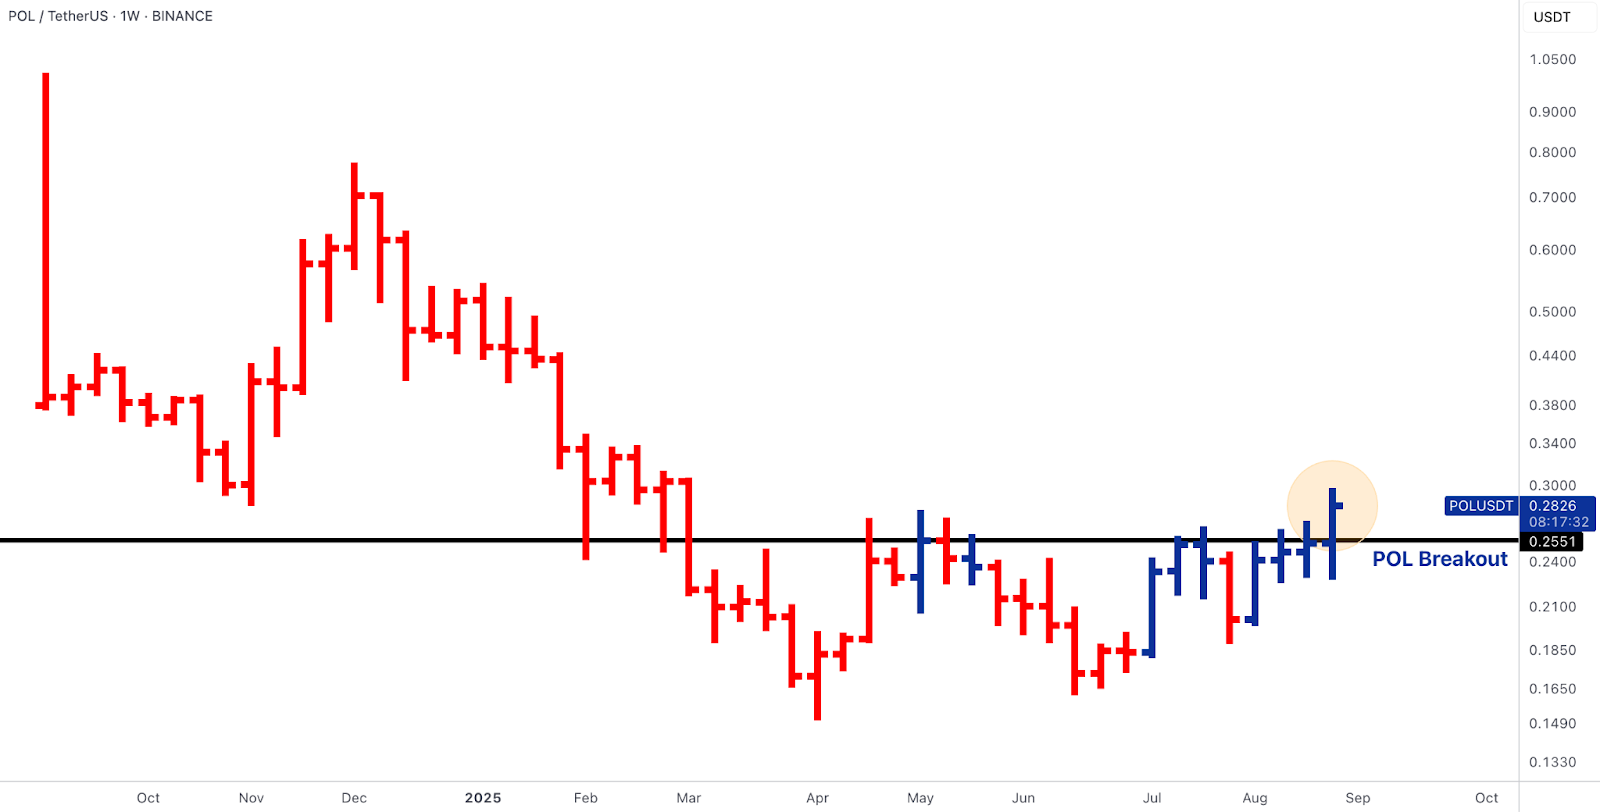
- POL advanced on mechanics rather than beta: with the POL migration effectively complete and broad exchange support in place, staking and infrastructure economics are now aligned.
- That alignment coincided with a weekly base breakout through ~0.255 on rising participation.
- For an institutional playbook, holding weekly above 0.255 keeps the break valid, the first objective sits ~0.32-0.34 (base height projection) with a stretch to ~0.37-0.38, while a weekly close back below 0.255 is the clean failure line.
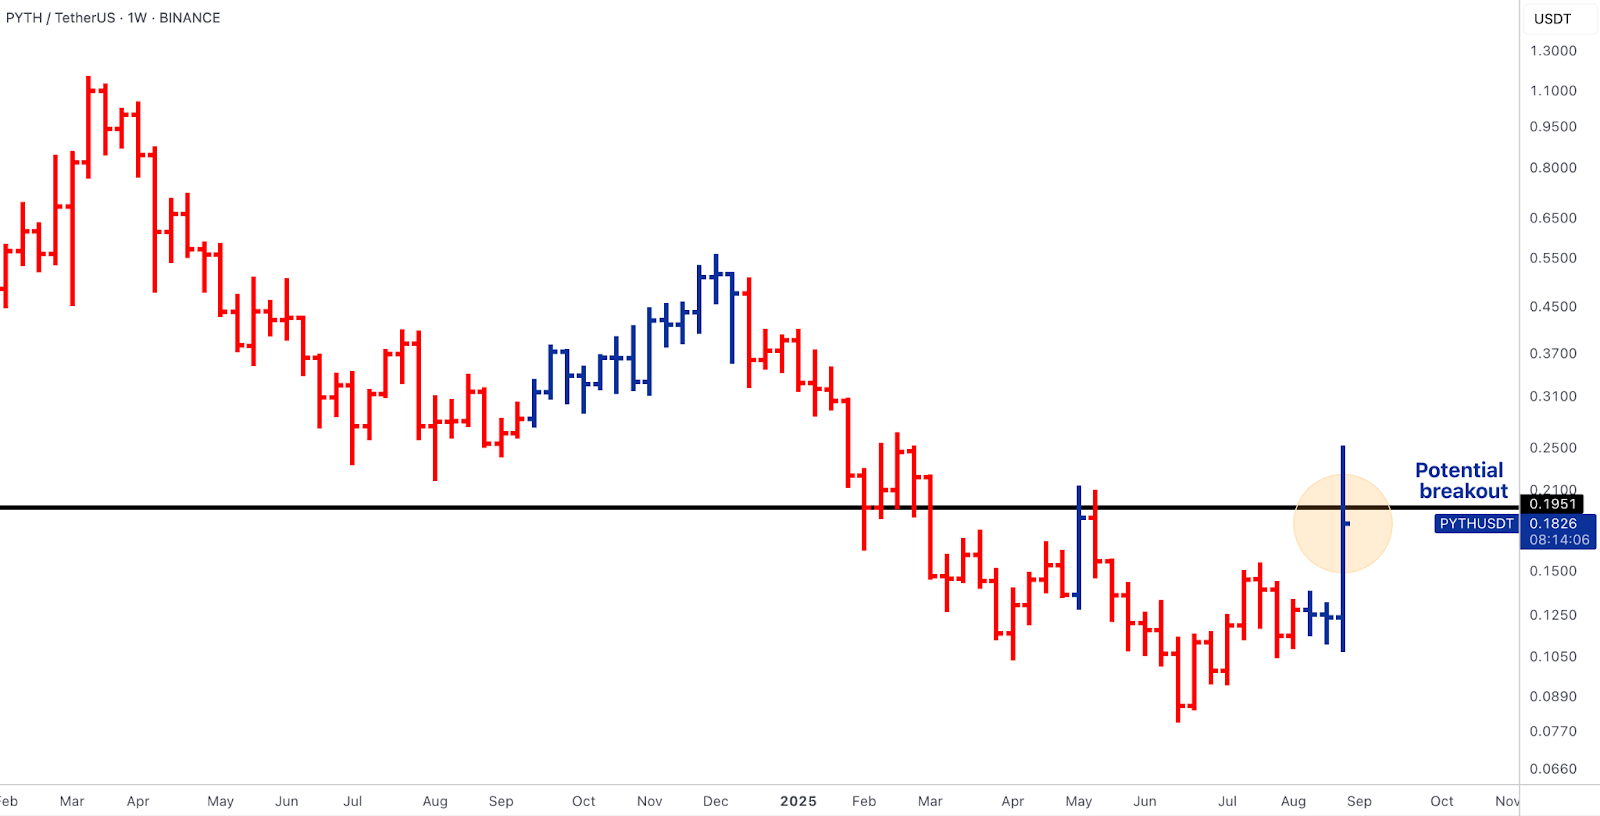
- PYTH rallied on a utility re-rate as official U.S. economic data dissemination on-chain is a tangible step for compliant structured-data products, pushing price into a weekly acceptance test above ~0.195.
- The path is similarly rule-based: accept >0.195 and the 0.23-0.25 supply band comes into play; reject and 0.155-0.160 is the higher-low area to defend.
- The tells here are oracle throughput growth, cross-chain publisher share, and funding that stays sane, with any >50% retrace of the impulse a yellow flag.
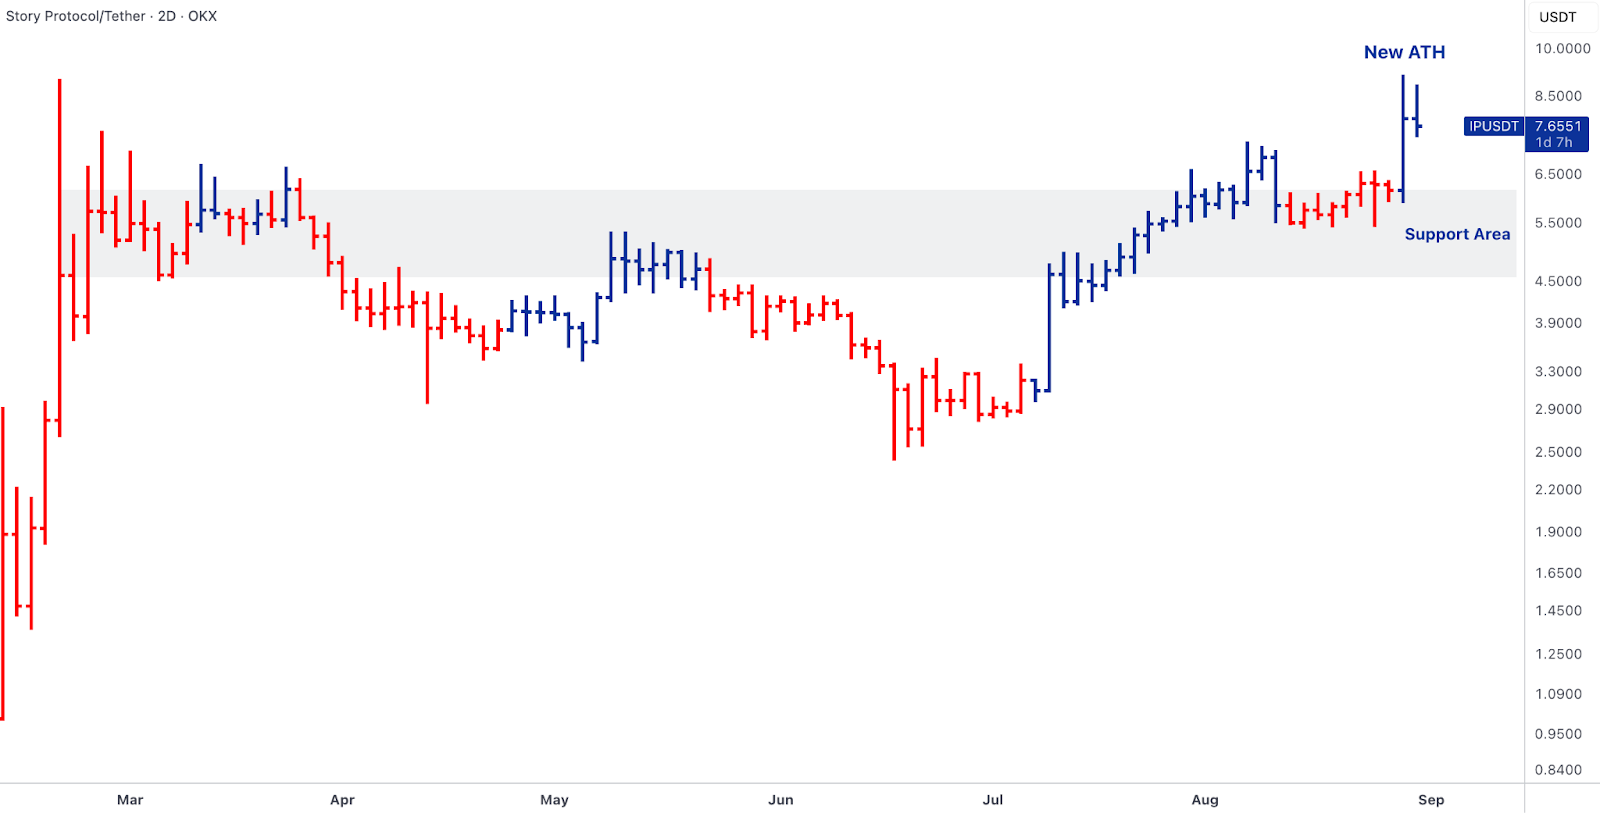
- IP (Story Protocol) continues to benefit from a programmatic bid stack, with a 90-day open-market buyback window funded by the recent capital raise, alongside a trust vehicle and corporate-treasury allocations creating visible, scheduled demand and pushing price to new all-time highs and a potential ATH weekly close.
- That should pull in trend followers, with the first line of defence being the breakout shelf around $5.5-$6.3; as long as daily/weekly closes hold above that zone and event-VWAP from the buyback, trend continuation is favoured.
- A close back below the pre-buyback base would signal the bid isn’t absorbing.
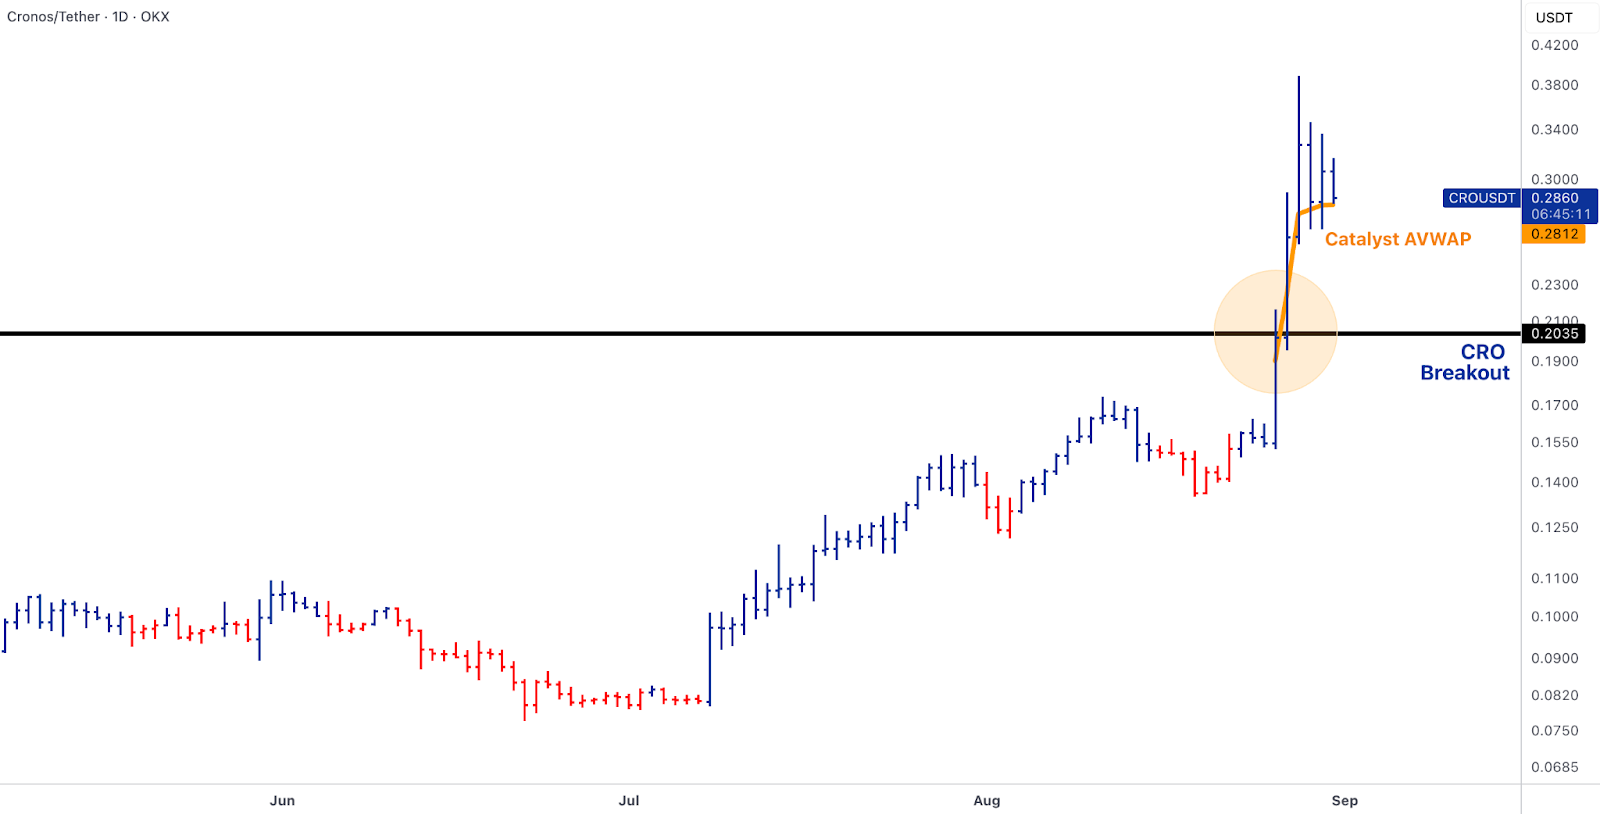
- Finally, the Trump Media/Crypto.com JV headline (public via SPAC) puts CRO at the centre of Truth Social rewards and a corporate treasury asset, with deal terms reportedly including ~$105M CRO purchased by TMTG, ~$50M DJT stock to Crypto.com, and a large committed-capital package.
- This should bring scheduled, visible token demand (a mechanical bid) plus equity cross-exposure.
- To separate signal from headline, treat the event-day VWAP as the first risk, the gap origin as invalidation, and look for net treasury buying cadence to print in the tape.
Dollar & credit rails - the pipes that decide where marginal flow lands
- Liquidity rails moved again this week in ways that matter for near-term market depth. Fresh USDT inventory minted on Ethereum over the weekend expands usable float and tends to tighten spreads/extend depth on bounce days, while USDC’s integration into a major bank payments hub broadens institutional fiat-to-stable routing beyond single-exchange on-ramps.
- In parallel, tokenised commercial-paper issuance advanced on bank-grade infrastructure, keeping the RWA flywheel of issuance, custody, and servicing in production.
- The operational read-through is simple: on stabilisation weeks, these pipes determine which venues and pairs absorb the next dollars, which is why infra/data assets keep catching a bid even when ETF prints are choppy.
- Watch stablecoin share shifts on top DEX/cex routes (USDT vs USDC), router path bias in quotes, and any uptick in attestation/data-feed consumption as tokenised credit ramps.
Outlook for the Week
- Macro-heavy week with China’s RatingDog manufacturing data kick-starting the week as the first key macro data. China’s August factory came in higher than expected and signalled the fastest expansion rate since March.
- A slew of US macro data is also due this week, including surveys of manufacturing and services, and the headline non-farm payroll on Friday. An inline or softer jobs data reading will further cement the expectations of a September Fed rate cut, which is currently ~88% probability.
- EU unemployment, inflation and GDP data are all due this week.
- Aside from macro data, political pressures are also in the deck as the Trump tariff policy is in doubt after a US federal appeals court ruling that most “reciprocal tariffs are illegal”.
- Investors will also be assessing developments in China and India relations as leaders from both countries attend the 2-day meeting of the Shanghai Cooperation Organisation regional security bloc.
Oops! Something went wrong while submitting the form.